Synopsis Visualize Pico Control Flow Graphs.
Examples

module demo::lang::Pico::Visualize import Prelude; import vis::Figure; import vis::KeySym; import demo::lang::Pico::Abstract; import demo::lang::Pico::ControlFlow; //Convert expressions into text str make(natCon(int N)) = "<N>"; str make(strCon(str S)) = S; str make(demo::lang::Pico::Abstract::id(PicoId Id)) = Id; str make(add(EXP E1, EXP E2)) = "<make(E1)> + <make(E2)>"; str make(sub(EXP E1, EXP E2)) = "<make(E1)> - <make(E2)>"; str make(conc(EXP E1, EXP E2)) = "<make(E1)> || <make(E2)>"; //
Add an editor to a node FProperty editIt(CFNode n) = (n has location) ? onMouseDown(bool (int butnr, map[KeyModifier,bool] modifiers){ edit(n.location,[]); return true;}) : onMouseDown(bool (int butnr, map[KeyModifier,bool] modifiers) {return false;}); //
Visualize one CFG node Figure visNode(CFNode n:entry(loc location)) = box(text("ENTRY"), vis::Figure::id(getId(n)), fillColor("red"), gap(4)); Figure visNode(CFNode n:exit()) = box(text("EXIT"), vis::Figure::id(getId(n)), fillColor("grey"), gap(4)); Figure visNode(CFNode n:choice(loc location, EXP exp)) = ellipse(text(make(exp)), vis::Figure::id(getId(n)), fillColor("yellow"), gap(8), editIt(n)); Figure visNode(CFNode n:statement(loc location, asgStat(PicoId Id, EXP Exp))) = box(text("<Id> := <make(Exp)>"), vis::Figure::id(getId(n)), gap(8), editIt(n)); //
Define the id for each CFG node str getId(entry(loc location)) = "ENTRY"; str getId(exit()) = "EXIT"; default str getId(CFNode n) = "<n.location>"; //
Visualize a complete CFG public Figure visCFG(rel[CFNode, CFNode] CFGGraph){ nodeSet = {}; edges = []; for(< CFNode cf1, CFNode cf2> <- CFGGraph){ nodeSet += {cf1, cf2}; edges += edge(getId(cf1), getId(cf2), toArrow(triangle(5, fillColor("black")))); } nodes = [visNode(n) | n <- nodeSet]; return graph(nodes, edges, hint("layered"), gap(20)); }
- We want to include the text of expressions in the relevant Figure nodes, this is achieved by
make( )
) - An editor property is attached to each Figure node (
 ): clicking on the node opens an editor for the corresponding file.
 -
visNodeimplements the visualization per CFG node ( ).
). - Since Figure nodes in a visual graph need an
idproperty, we define here a scheme to associate unique identifiers to each Figure node ( ).
). - The complete visualization of a CFG is implemented by
visCFG( ): it gets the CFG hraph as arguments and then
 - creates all Figure edges,
- creates all Figure nodes,
- returns a Figure graph.
import demo::lang::Pico::ControlFlow;
import demo::lang::Pico::Visualize;
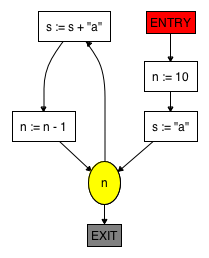
CFG = cflowProgram("begin declare n : natural, s : string; n := 10; s := \"a\"; while n do s := s + \"a\"; n := n - 1 od end");
render(visCFG(CFG.graph));
The resulting visualization looks like this:
