Synopsis Visual presentation of scientific or abstract data.
Description Visualization is the activity of presenting scientific data or abstract structures
in a visual form. There are several subareas:
- Scientific visualization
 : deals with data that are geometric in nature and may have a time dimension.
- Information visualization
 : deals with abstract data structures like trees, graphs and relations.
 - Software Visualization
 : deals with facts related to software.
Examples  version.

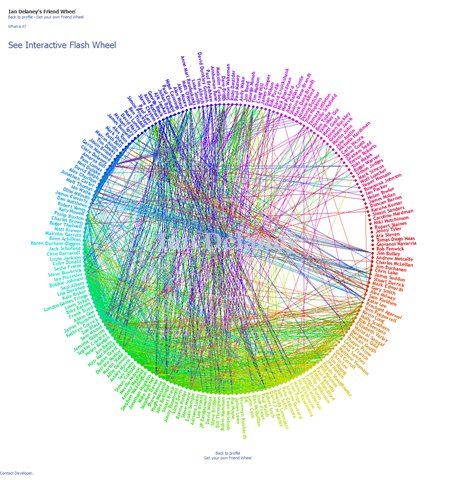
 shows the connection between friends:

 the frequency of execution for each line
in all source files of a software system.

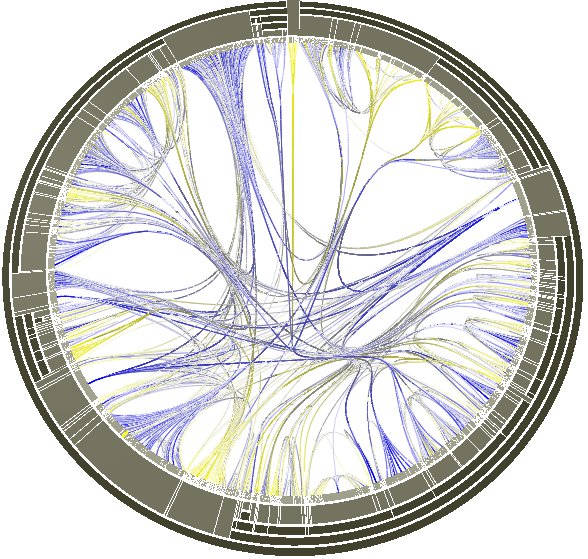
Daniel Bierwirth shows the connections (colored lines) between system components (at outer circle).

Scientific visualization
Robert vam Liere and Wim de Leeuw have visualized liquid flows. There is also an animated
Information Visualization
Facebook's Friend Wheel
Software Visualization
Stephen Eick visualizes
Daniel Bierwirth shows
