Synopsis Composition of figures by superposition.
Function
Figure overlay(Figures figs, FProperty props...)
Description Composition of a list of figures by overlaying them on top of each other.
Alignment gives detailed control over the position of figures in an overlay.
This can be used to create arbitrary shapes. These shapes can be further controlled
by
- connecting the figures in the overlay, see shapeConnected.
- make a smooth connection between figures in the overlay, see shapeCurved.
- connecting the first and the last figure in the shape, see shapeClosed.
- using fillColor to define the area color of the closed shape.
- using hconnect or vconnect to determine where the figures in a shape will be connected.
Examples 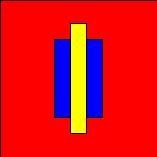
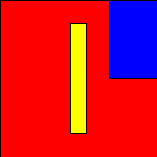
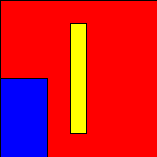

Alignment gives detailed control over the position of figures in an overlay.
The overlaid figures can be connected by using shapeConnected:

The next enhancement is to close the begin and end points of the shape, using shapeClosed:

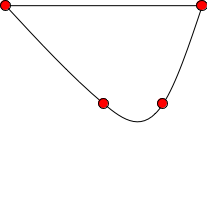
Another enhancement is to use curves to connect the figures in the shape, using shapeCurved:
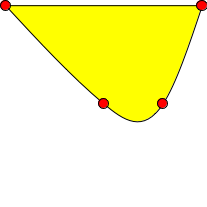
A final enhancement is to set the fill color of the closed shape:
The hconnect and vconnect properties can be used to determine where a shape will connect with a figure.

b1 = box(shrink(1.0,1.0), fillColor("Red"));
b2 = box(shrink(0.3,0.5), fillColor("Blue"));
b3 = box(shrink(0.1,0.7), fillColor("Yellow"));
render(overlay([b1, b2, b3]));
gives: 
b1 = box(shrink(1.0,1.0), fillColor("Red"));
b2 = box(shrink(0.3,0.5), fillColor("Blue"),top(),right());
b3 = box(shrink(0.1,0.7), fillColor("Yellow"));
render(overlay([b1, b2, b3]));
gives: 
b1 = box(shrink(1.0,1.0), fillColor("Red"));
b2 = box(shrink(0.3,0.5), fillColor("Blue"),bottom(),left());
b3 = box(shrink(0.1,0.7), fillColor("Yellow"));
render(overlay([b1, b2, b3]));
gives: 
b1 = box(shrink(1.0,1.0), fillColor("Red"));
b2 = box(shrink(0.3,0.5), fillColor("Blue"),bottom(),left());
b3 = box(shrink(0.1,0.7), fillColor("Yellow"),right());
render(overlay([b1, b2, b3]));
gives: 
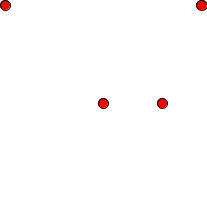
Alignment gives detailed control over the position of figures in an overlay.
Figure point(num x, num y){ return ellipse(shrink(0.05),fillColor("red"),align(x,y));}
coords = [<0.0,0.0>,<0.5,0.5>,<0.8,0.5>,<1.0,0.0>];
ovl = overlay([point(x,y) | <x,y> <- coords]);
render(ovl);
gives:

The overlaid figures can be connected by using shapeConnected:
Figure point(num x, num y){ return ellipse(shrink(0.05),fillColor("red"),align(x,y));}
list[tuple[num,num]] coords = [<0.0,0.0>,<0.5,0.5>,<0.8,0.5>,<1.0,0.0>];
ovl = overlay([point(x,y) | <x,y> <- coords], shapeConnected(true));
render(ovl);
gives:

The next enhancement is to close the begin and end points of the shape, using shapeClosed:
Figure point(num x, num y){ return ellipse(shrink(0.05),fillColor("red"),align(x,y));}
coords = [<0.0,0.0>,<0.5,0.5>,<0.8,0.5>,<1.0,0.0>];
ovl = overlay([point(x,y) | <x,y> <- coords], shapeConnected(true),
                                              shapeClosed(true));
render(ovl);
gives:

Another enhancement is to use curves to connect the figures in the shape, using shapeCurved:
Figure point(num x, num y){ return ellipse(shrink(0.05),fillColor("red"),align(x,y));}
coords = [<0.0,0.0>,<0.5,0.5>,<0.8,0.5>,<1.0,0.0>];
ovl= overlay([point(x,y) | <x,y> <- coords], shapeConnected(true),
                                             shapeClosed(true),
                                             shapeCurved(true));
render(ovl);
gives:

A final enhancement is to set the fill color of the closed shape:
Figure point(num x, num y){ return ellipse(shrink(0.05),fillColor("red"),align(x,y));}
coords = [<0.0,0.0>,<0.5,0.5>,<0.8,0.5>,<1.0,0.0>];
ovl = overlay([point(x,y) | <x,y> <- coords], shapeConnected(true),
                                              shapeClosed(true),
                                              shapeCurved(true),
                                              fillColor("yellow"));
render(ovl);
gives:

The hconnect and vconnect properties can be used to determine where a shape will connect with a figure.
b1 = box(shrink(0.2),vconnect(1.0),hconnect(1.0),top(),left(),fillColor("red"));
e1 = ellipse(size(25),resizable(false),vconnect(0.0),bottom(),fillColor("green"));
b2 = box(shrink(0.2),vconnect(0.0),hconnect(0.0),aspectRatio(1.0),top(),right(),fillColor("blue"));
ovl = overlay([b1,e1,b2 ],shapeConnected(true),shapeClosed(true),fillColor("yellow"));
render(ovl);
gives:
